Forecasting Survey Guide
Economists and other social scientists are increasingly collecting forecasts of research results. Forecasts are typically collected before research results are known. These forecasts can be used to contextualize research findings, mitigate publication bias, and improve the design of experiments. You can find a short summary of our platform and purpose on our Purpose page.
In the Survey Design section of this page, we outline some key features to include when designing research forecasting surveys, though not all features will be relevant for each study. We also provide an overview of how to use the platform to elicit forecasts. A template Qualtrics survey can be found under the Qualtrics Template header.
INTRODUCTION
Forecasts can be collected for both experimental and nonexperimental studies, and for treatments effects and other study parameters. For example:
-
Predicting treatment effects
- Bessone et al. (2020) collect forecasts of the effects of a sleep intervention in India.
- Casey et al. (2018) collect forecasts of results form a community-driven development intervention in Sierra Leone.
- Cohn et al. (2019) collect forecasts of results from a field experiment testing the return of lost wallets around the world.
- DellaVigna et al. (2020) collect forecasts of results from three registered reports from the Journal of Development Economics.
- Groh et al. (2016) collect forecasts of the effects of soft skills training in Jordan.
- Vivalt and Coville (2019) examine how policymakers update their beliefs about the effectiveness of development interventions based on new information.
-
Predicting horse race comparing many treatments
- DellaVigna and Pope (2018) collect forecasts of the effects of behavioral interventions on a costly effort task.
-
Predicting non-causal estimates
- Card et al. (2019) collect predictions about gender differences in the association between citations and paper quality.
- Dreber et al. (2015) and Camerer et al. (2016) elicit predictions of the probability that experiments would replicate.
Reliable image hosting: If you include images in your survey, make sure that they are hosted reliably. We recommend stable image hosting platforms such as https://imgbb.com/ or github. If you host survey images on your personal website, be aware that changing the directory where images are stored will result in failure to display images in your survey.
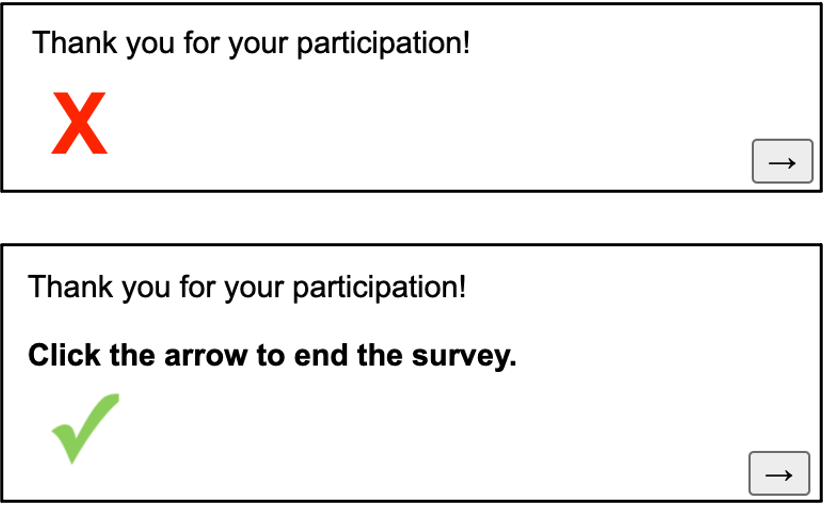
Remind respondents to finish survey: It is fairly common for respondents not to click the arrow on the final page of the survey that officially marks their response as complete. If respondents fail to do this, their response will not be logged in the count of completed survey responses we display (once the survey has closed, you will still be able to view these "partial" responses). We recommend that you remind participants on the last page that they need to proceed to the next page to officially end the survey.

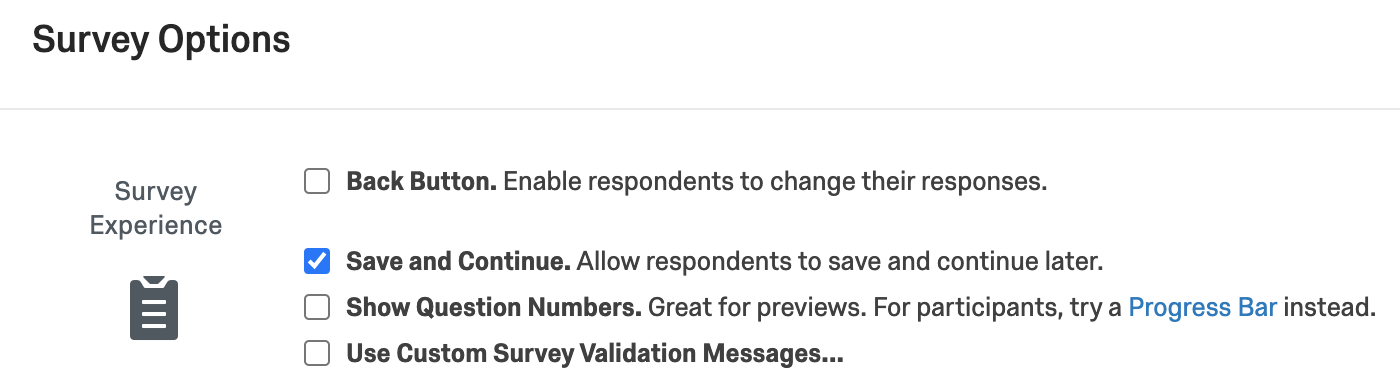
Back button: A number of forecasters have requested that surveys include a back button. You can select this option by going to Survey Options and selecting the Back Button box.
Provide a reminder of the study description: Many forecasters want to revisit the study description when providing their forecasts. We recommend that you provide an external link to your survey description that respondents can have open in a separate window while providing predictions (For example, we provide an annotated survey annotated survey in which we provide an external link to the study overview. You can find more examples here here). Alternatively, a short review of the study details can be provided on each page.
Preview before publishing: We strongly recommend that you preview your survey within the platform before publishing it. This option is available for surveys that have been "approved", and can be found on the Manage Survey page:
SURVEY DESIGN
-
Yang et al. (TBD) examine effects of a community health intervention on HIV testing in Mozambique.
- At the time we collected forecasts, baseline was complete, but the fidelity of the intervention was not known.
- View annotated survey here
-
Bouguen and Dillon (TBD) run an experiment examining effects of a multi-armed cash, assets, and nutrition intervention in Burkina Faso.
- We collected forecasts after midline had been completed, and we had some information on how treatment implementation was.
- View annotated survey here
-
Blimpo and Pugatch (TBD) evaluate the effects of a teacher training intervention in Rwanda.
- We had information from the control group at endline when we collected predictions.
- View annotated survey here
When designing a forecasting survey, it is important to consider:
- The target population (e.g. nonexperts may require an explanation of random assignment).
- Survey length (to reduce survey fatigue, we recommend surveys take 10-15 minutes to complete).
A typical forecasting survey has three parts: (1) a description of the study, (2) a description of the predicted outcome, and (3) elicitation of the predicted outcome. In the menu below, we provide examples highlighting the design decisions for three studies predicted in DellaVigna et al. (2020).
Part 1: Describing the study
The study description is a one to two page summary highlighting key study details. A link to a more complete study description can be provided for interested respondents. Generally, a study description should include information on the target population, sample size, randomization, interventions, and study timing.
Part 2: Describing the predicted outcome
Respondents should be aware of how the outcome they are predicting is being measured (e.g. through an online survey) and how the outcome is constructed (e.g. we are interested in a composite measure of x,y, and z).
Part 3: Forecast elicitation
There are a number of ways to elicit predictions of experimental results. For example, are respondents providing predictions of a treatment effect, or of a conditional mean? Are predictions made using a slider scale, or numeric entry? Are predictions in raw units, or standard deviations?
When should forecasts be collected?
Forecasts can be collected at any phase in the research process before experimental results are known. This includes:
(1) After an initial study design has been developed but before data collection has begun.
(2) After baseline or midline has been conducted (for experimental studies).
(3) After endline has been completed, but before results have been examined.
In general it is better to collect forecasts before experimental results are known (unless forecast outcomes were pre-specified) to avoid collecting predictions on “unusual” results (e.g. null effects or very large effects).
Outliers
Often we are interested in the average forecast, which can be influenced by extreme values.
A common strategy to reduce the likelihood of outliers is to bound the response scale in Qualtrics. Many project teams choose to bound response scales at +-1 standard deviations, though this will depend on the outcome and context.
A complementary strategy is to consider transformations like winsorization that can limit the influence of outliers. Another alternative is use measures of forecast centrality like the median forecast which are less susceptible to outliers than the mean prediction.
Modifying variable labels: Each variable is given an automatic label containing the beginning of the question text. You may want to change the question label to provide a brief description of the question. The example above could be labelled "forecasts of consumption".

More information can be found on the Qualtrics website under Editing Question Labels.
Modifying variable values: Qualtrics sometimes assigns values to responses on multiple choice questions that you might not expect. You may want to check what numbers Qualtrics has assigned and modify the number associated with the responses accordingly. For example, in the figure below, you may want to label the values 1 and 2, as opposed to 4 and 5. To view and/or modify the value labels, first click the gear icon, then select "Recode Values".

More information can be found on the Qualtrics website.
Numeric response bounds: You may want to bound the range of forecasts respondents can provide for text response questions. Bounding can reduce the risk of entry errors. In the example below, we bound responses at +-2 (standard deviations), since the literature suggests that effects outside this range would be very unlikely.


Sliders and mobile devices We have received numerous reports that slider scales are difficult to use on mobile devices. If you think your targeted respondent pool will contain many users who complete the survey on their mobile device, we would caution you against using slider scales. For more information, see Qualtrics Mobile Survey Optimization page.
Image hosting: We are not able to host images on our Qualtrics account. Therefore, images referenced in your Qualtrics file need to be externally hosted. After you upload your survey, be sure to go through it using the "preview" function to check for formatting issues before the survey is distributed.
USING THE PLATFORM
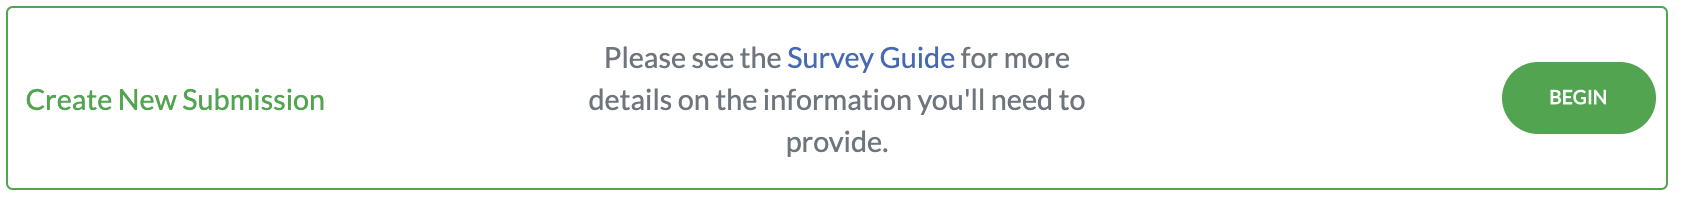
- Register your survey, and upload your .qsf file.
- Select your key prediction questions.
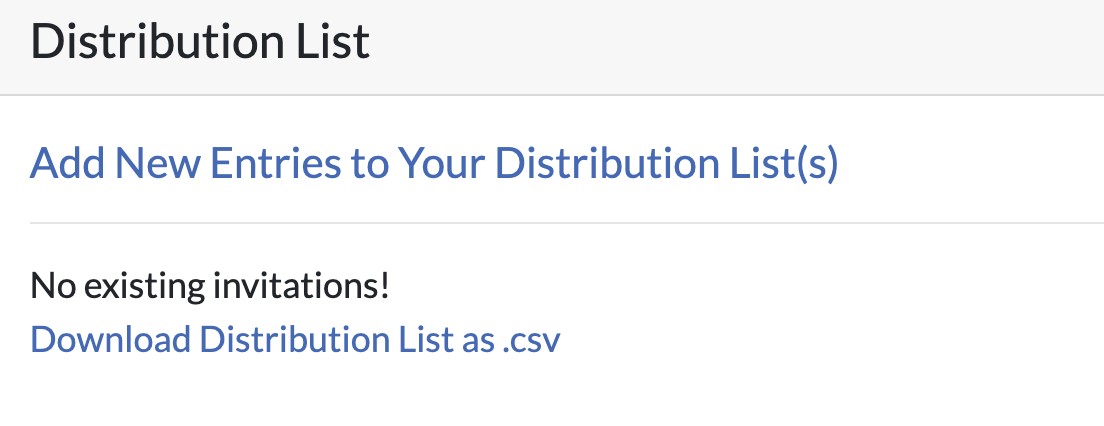
- Provide an initial distribution list.
- Wait for approval from platform staff.
- Distribute your survey.
Step 1 of registration requires that you provide the following information for your study:
- Title
- Completion Time
- Close Date
- Have data been collected for this study?
- Have or will the main outcomes for this study be pre-registered?
- Anticipated date when study results will be known to project team
- Field
- Location of Study
- Abstract
- Visibility:
- Invite Only: Only the respondents you list will be able to access the survey.
- Researchers Only: This survey will be open to respondents logged in with a Researcher account.
- Public: This survey will be open to the general public.


In order to reduce burden to platform users, we ask that you answer a few short questions about a key forecasting question, such as the main outcome of your study. After the study is completed, we will ask that you report the results for this outcome to us. If you select multiple key questions, we will ask you to report the results for each of them.
To select key questions, navigate through your survey using the built-in preview function of the platform:

When you select a key question, you will be asked to provide the following information: What is the subject of the question?
- A summary statistic (e.g. a conditional mean)
- A causal estimation (e.g. an average treatment effect)
- A first stage estimate (e.g. for an IV regression)
- Other
- Text
- Slider
- Standard deviations
- Percentage points
- Percent
- Other
- Yes
- What is it?
- Is the statistic provided to forecasters
- No
Measures of forecaster confidence can serve several purposes:
- They allow forecasts given with different degrees of confidence to be treated differently.
- They enable us to learn about how confidence correlates with accuracy.
- They can help measure the extent to which forecasters are well-calibrated; a perfectly calibrated forecaster is able to accurately assess the proportion of their forecasts that fall within some bounds.
- Likert scale: How confident are you in this prediction? {Not at all confident, Slightly confident, Somewhat confident, Very confident, Extremely Confident}
- Percent within bounds: What percent of your forecasts do you think will fall within 50% of the observed experimental effect?
- Note that in the latter example, we have selected a large bound (+-50%) due to the prevalence of overprecision among forecasters.
- Bounds need not be provided in percent. For example, you could choose to provide bounds in standard deviations.
- The bounds you decide on will depend on your research questions and context.
Under no circumstances will we provide the survey elicitor with a respondent's name or email address. However, it is possible that a respondent could be re-identified based on other information they provide. Platform administrators will also have access to the information respondents provided during registration.
Accessibility
When registering your survey, you will have to select who will be able to access it. There are 3 options:- Open to specific platform users: Only the respondents you list will be able to take the survey. If they do not have an account, they will be required to make one with an email that matches that of their invitation.
- Open to any platform user: This survey will be open to anyone who has an account on the platform and a link to the survey
- Public: This survey will be open to anyone with a link. No account on the platform is necessary. You may want to select this option if you plan to share the link over Twitter.
Distribution
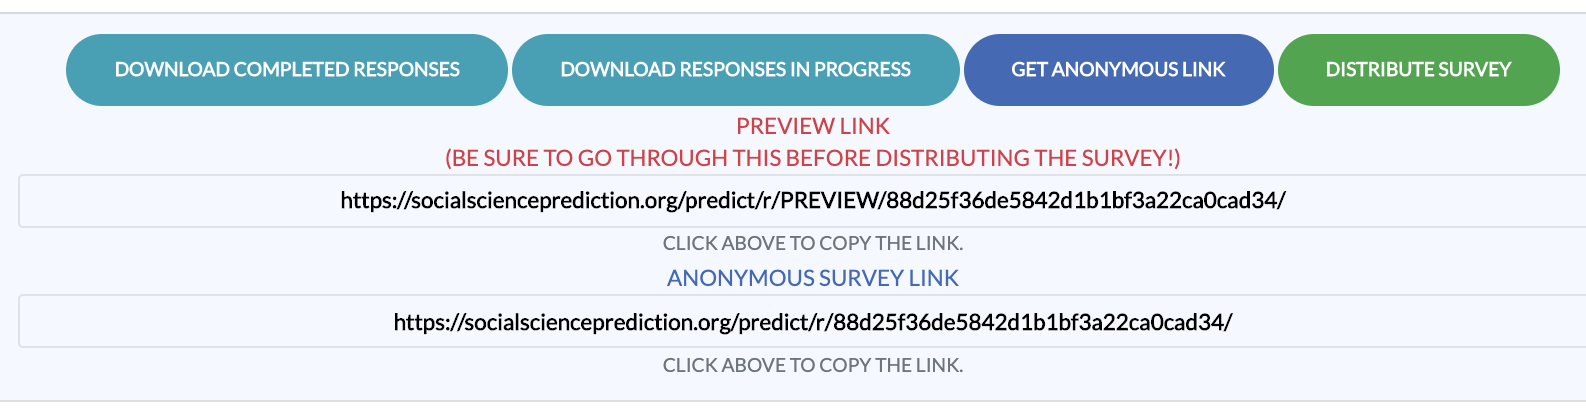
These accessibility options are complemented by three different (non-exclusive) ways to distribute the surveys:- Anonymous link To distribute your survey through an anonymous link, simply select Get Anonymous Link. The single anonymous survey link can be distributed to your target audience.
- Collecting predictions through the Prediction Dashboard The second way to collect predictions is by publicizing your survey on the Social Science Prediction Dashboard.
- Email Distribution Once you are at the Survey Dashboard, you can send the survey to your distribution list (see the section above) by selecting Distribute Survey.

If you are using anonymous links, we recommend you set the accessibility options to "Public".
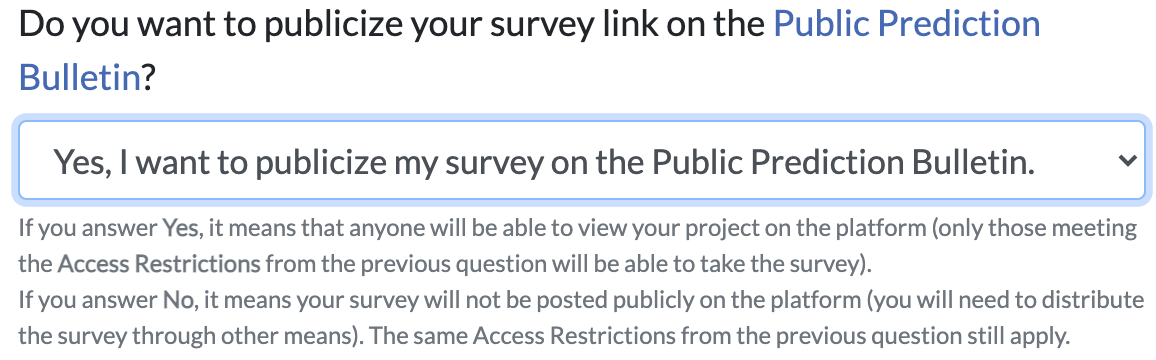
If you are posting the survey on the Prediction Dashboard, we recommend you set that you do not set the accessibility as "Open to specific platform users".
Here, you will be provided with a template email that will be sent to your survey respondents. You can modify this template, but you must keep the text “[[ SHARE LINK ]]”, which will be automatically filled with the survey link when the survey is distributed.
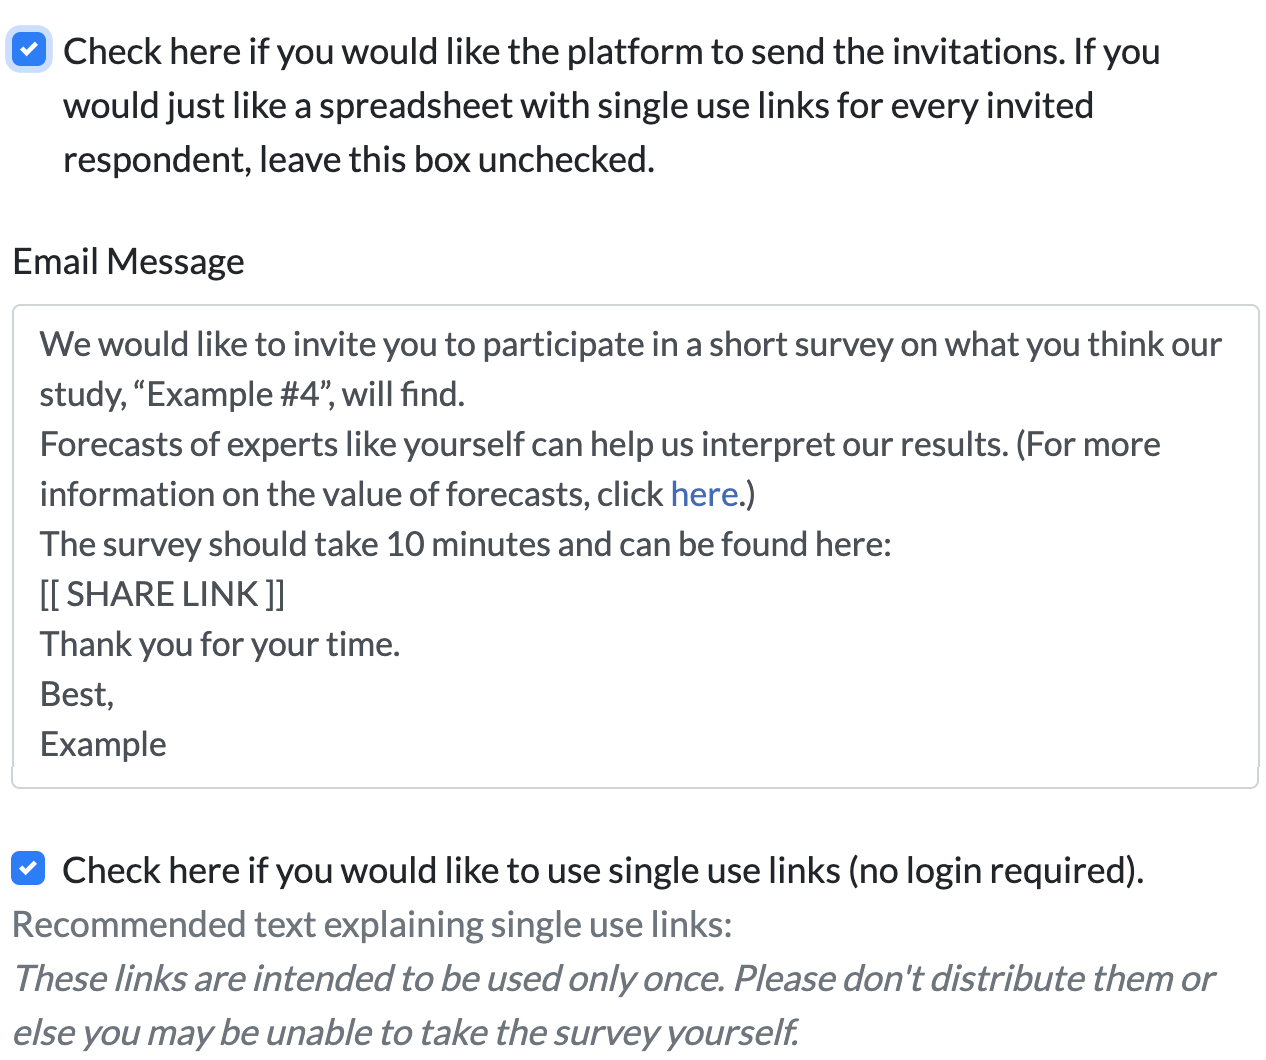
If you would like to generate links for each participant on your contact list, leave the top box unchecked. If you would like the links (distributed by the platform) to be single use, check the second box.
Using the Duplicate function to track multiple distribution methods
What if you want to use multiple data collection formats? For example, you may want to post an anonymous link on Twitter, and also to send emails to a small number of experts who have published work related to your study, where only those targeted individuals would be able to use the assigned links.This can be achieved using the "Duplicate" function (found in the "Additional options" section of the survey page), which creates a copy of your project, allowing you to adjust the survey restrictions for each target population.
Whenever a survey is taken by a platform user, we collect the following information:
What describes you best? Please select "yes" if you are currently one of the following: {Graduate student (Master level or PhD), Faculty, Post-doc, Non-academic researcher}
IF YES:
- Institution
- Discipline {Economics, Political Science, Psychology, Sociology}
- Title {Professor,Assistant Professor, Post-doc, Researcher, PhD Student, Masters Student}
- If "Researcher" is selected: What is the highest level of education you have attained? {Bacheor's degree, Masters degree, PhD, other graduate/professional degree}
- Field {Main fields of each discipline}
IF NO:
- What type of organization do you currently work for? {Academia/research institute,Government,International organization,NGO,Private sector,Other:__}
- What is the highest level of education you have attained? {Bachelors degree, Masters degree, PhD, other graduate/professional degree}
- Sector
By default, we add the following four questions to the end of the survey. If you are interested in including them, they will be automatically appended to your Qualtrics survey during the upload phase, so there is no need for you to include them in the version of the survey you upload. If you do not with to include these questions, simply check the boxes at the bottom of the "Append Questions" stage in the upload process.
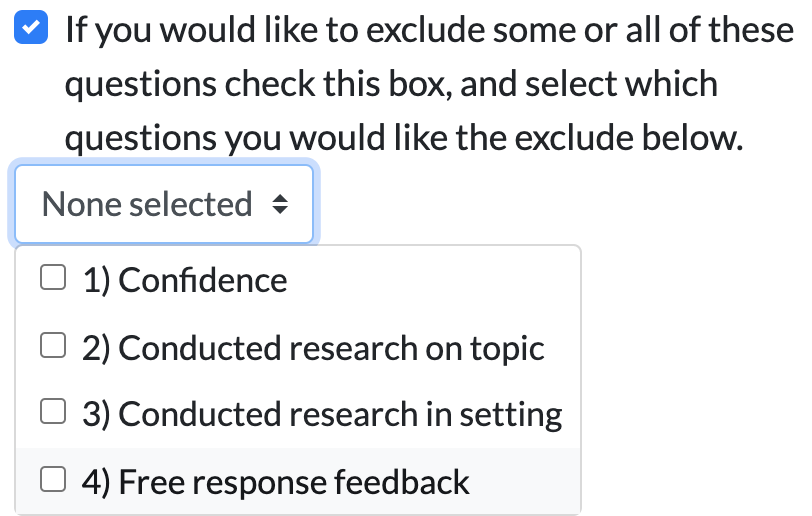
1) How confident are you in your predictions for this study? If you are confident, it means that you believe your predictions are very accurate.
{Not at all confident, Slightly confident, Somewhat confident, Very confident, Extremely Confident}
2) Have you conducted research on the topics covered in this survey? {No, Yes}
We encourage you to change the question text to fit your study topic. For example, if the study topic is depression, "the topics covered in this survey" could be changed to "mental health".
3) Have you conducted research in the setting where this study takes place? {No, Yes}
We encourage you to change the question text to fit your study setting. For example, "the setting where this study takes place" could be changed to "rural Kenya". For online studies, consider the sample pool (such as Mechanical Turk).
4) If you have any comments, please enter them below. We would love to hear your feedback. [Free response]